2-punktsestimat
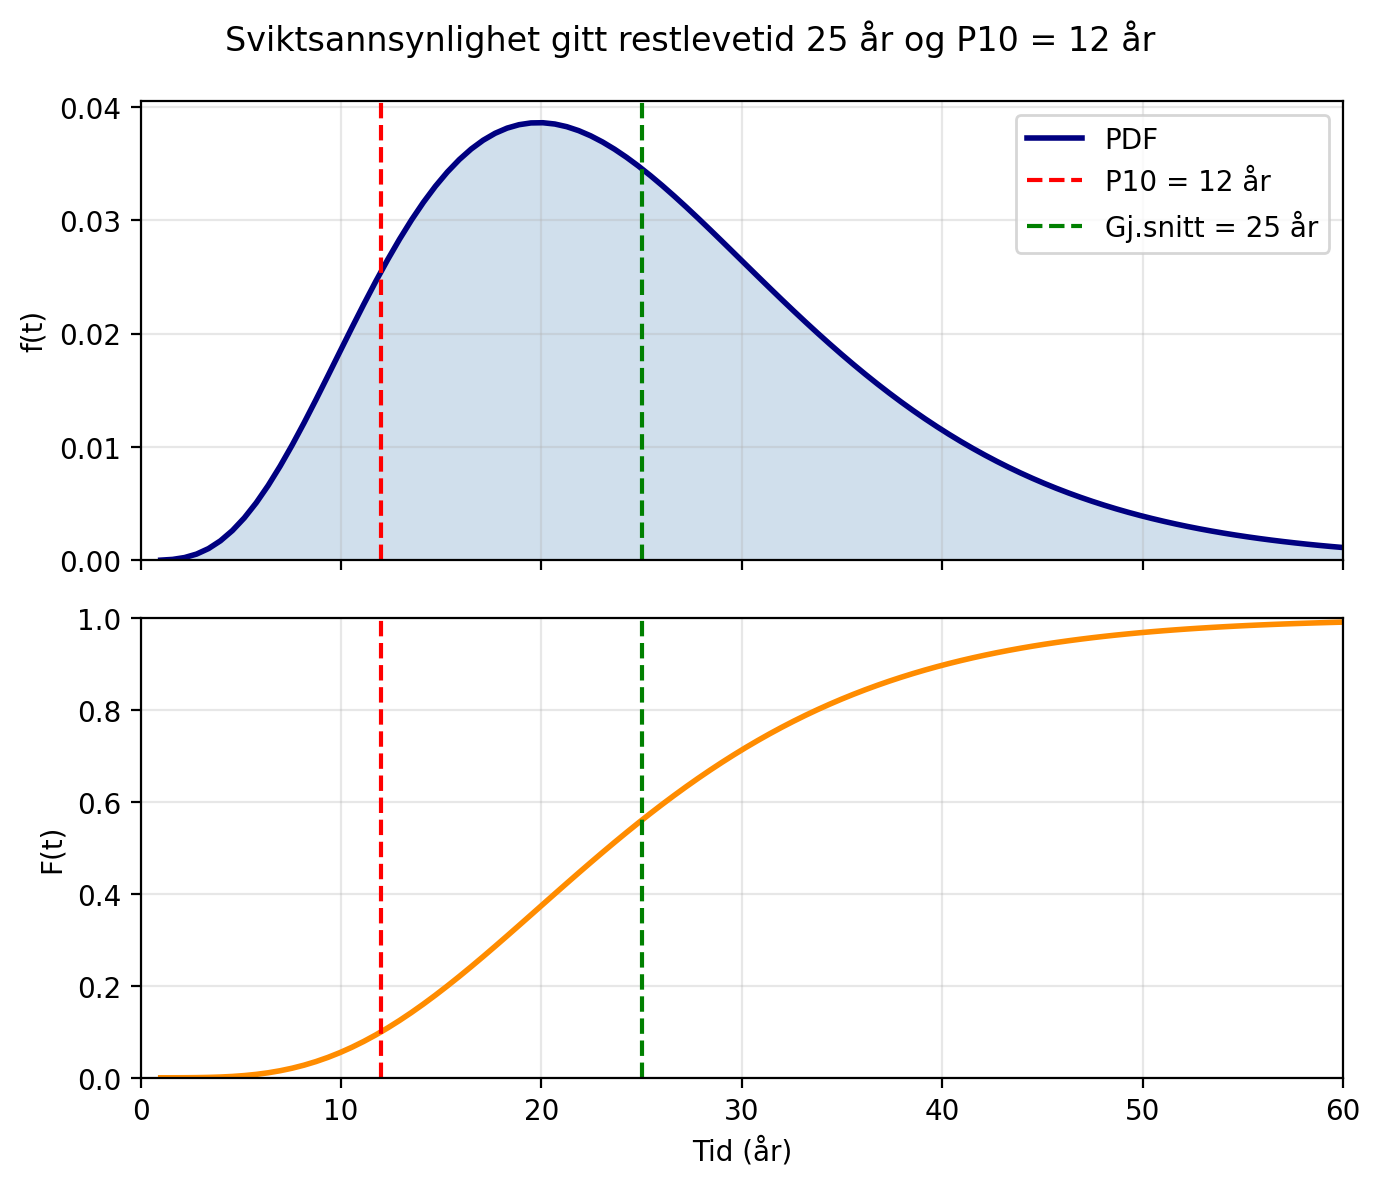
Denne metoden bruker to ekspertvurderinger i form av gjennomsnittlig restlevetid og 10 persentil (P10) for å kurvetilpasse en gammafordeling.
Source
import numpy as np
from scipy.stats import gamma
import matplotlib.pyplot as plt
from scipy.optimize import root_scalar
%config InlineBackend.figure_format = 'retina'
Et eksempel på ekspertvurderinger er gitt under sammen med en funksjon for å finne optimale gamma parametre alpha og theta.
Tbar = 25   # gjennomsnittlig restlevetid
P10 = 12    # 10 persentil

def fit_gamma_from_mean_p10(mean_life, p10):
    def objective(alpha):
        theta = mean_life / alpha
        return gamma.cdf(p10, alpha, scale=theta) - 0.10

    result = root_scalar(
        objective,
        bracket=[0.1, 100],
        method='brentq'
    )

    alpha = result.root
    theta = mean_life / alpha

    return alpha, theta
alpha_star, theta_star = fit_gamma_from_mean_p10(Tbar, P10)
print(f'Beste alpha: {np.round(alpha_star,1)}')
print(f'Beste theta: {np.round(theta_star,1)}')Beste alpha: 4.9
Beste theta: 5.2
Source
t = np.linspace(1,60,100)
pdf = gamma.pdf(t, alpha_star, loc = 0,scale = theta_star)
cdf = gamma.cdf(t, alpha_star, loc = 0,scale = theta_star)

fig, ax = plt.subplots(
    2,
    1,
    figsize=(7, 6),
    sharex=True
)

fig.suptitle(
    f"Sviktsannsynlighet gitt restlevetid {Tbar} år og P10 = {P10} år",
    fontsize=12
)

ax[0].plot(
    t,
    pdf,
    color="navy",
    lw=2,
    label="PDF"
)

ax[0].fill_between(
    t,
    pdf,
    color="steelblue",
    alpha=0.25
)

ax[0].axvline(
    P10,
    color="red",
    ls="--",
    lw=1.5,
    label=f"P10 = {P10} år"
)

ax[0].axvline(
    Tbar,
    color="green",
    ls="--",
    lw=1.5,
    label=f"Gj.snitt = {Tbar} år"
)

ax[0].set_ylabel("f(t)")
ax[0].set_ylim(bottom=0)
ax[0].grid(True, alpha=0.30)
ax[0].legend()

ax[1].plot(
    t,
    cdf,
    color="darkorange",
    lw=2,
    label="CDF"
)

ax[1].axvline(
    P10,
    color="red",
    ls="--",
    lw=1.5
)

ax[1].axvline(
    Tbar,
    color="green",
    ls="--",
    lw=1.5
)

ax[1].set_ylabel("F(t)")
ax[1].set_xlabel("Tid (år)")
ax[1].set_ylim(0, 1)
ax[1].grid(True, alpha=0.30)

for a in ax:
    a.set_xlim(0, 60)

plt.tight_layout()
plt.show()